Usage
In general, this is the flow:
- Get your samples into a pandas dataframe. If you have another format and want to contribute a translation function, that would be amazing.
- Turn those samples into a
Chain. At this point, you can specify a ton of visual and statistical choices. - Give those chains to
ChainConsumer - If you know the truth value of the chains, you can call
c.add_truth(Truth(...))to add this to your plots. Note you can have as many truth lines as you want, not just one. - If you want to change plotting specific options (but not chain specific options), you can
set_plot_config(PlotConfig(...))to control things like the number of ticks, font size, etc. - Optionally, use the diagnostics available to see if your chains are stable, or do this via using
plot_walks - Make your contours via
plot, or your summaries, or your LaTeX tables.
Statistics
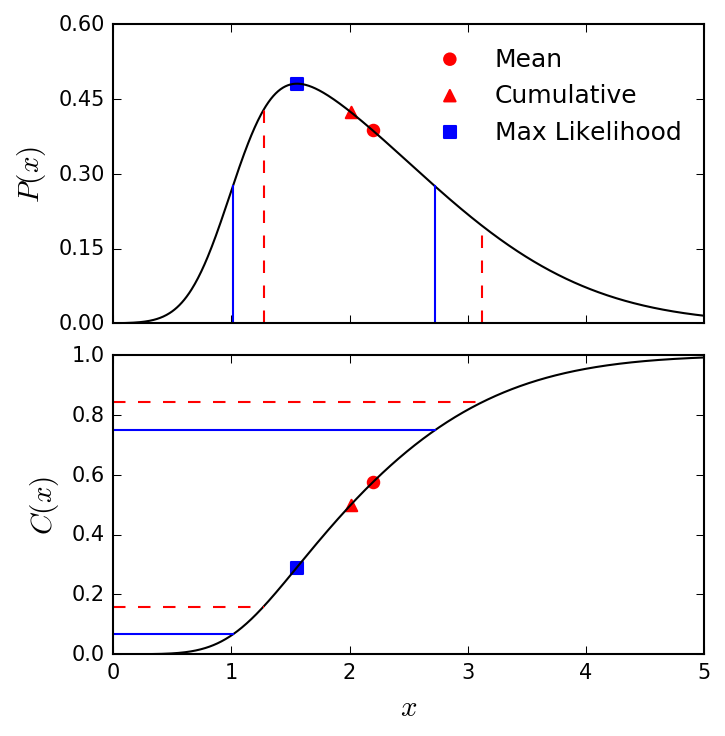
When summarising chains, ChainConsumer offers several different methods. The below image shows the upper and lower bounds and central points for the MAX, CUMULATIVE, MEAN and HDI methods respectively, with their associated bounds.
chainconsumer.statistics.SummaryStatistic 
Bases: Enum
Source code in src/chainconsumer/statistics.py
MAX
class-attribute
instance-attribute
The max value summary statistic is the default. The central point is set to your maximum likelihood, and the upper and lower bounds are determined by finding an iso-likelihood surface which encapsulates the required volume.
MAX_CENTRAL
class-attribute
instance-attribute
As per the MAX method, this has the centre point at the maximum likelihood. However the lower and upper values come from the CDF, like the cumulative method.
CUMULATIVE
class-attribute
instance-attribute
The lower, central, and upper bound are determined by finding where on the marginalised sample CDF the points lie. This means the central point is the median.
MEAN
class-attribute
instance-attribute
As per the cumulative method, except the central value is placed in the midpoint between the upper and lower boundary. Not recommended, but was requested.
HDI
class-attribute
instance-attribute
Use the highest density interval. Finds the narrowest interval covering the requested mass.
Why all these classes and not just kwargs?
Python type hinting for kwargs isn't quite there yet. TypedDict with Python 3.12 is a big step forward,
but I know it'll be a while before the scientific community is all on 3.12. The initial version of ChainConsumer,
which was Python 2.7 compatible, didn't have type hints at all. It just took tons of kwargs and passed them around,
which also caused a huge ton of duplicated docstring and functions. By encapsulating the options into a dataclass,
it becomes much easier for anyone, me or someone who wants to contribute to the repo, to simply add to this class.
You don't need to remember to update five other functions, and their docstring. I like that. I don't like the extra verbosity, but it's a price I'm willing to pay for more explicit code and better type hinting.
How to do overrides
When you make a Chain, you specify its initial properties.
c = ChainConsumer()
chain = Chain(samples=df, name="Something", shade=True, plot_point=True, color="red")
c.add_chain(c)
If you then tell ChainConsumer to add an override, this will then replace your original value, for all chains.
I note that this override does not modify your original chain. When the plotting code requests final chains from ChainConsumer, the initial chains are copied and their attributes updated by the override.