Note
Click here to download the full example code
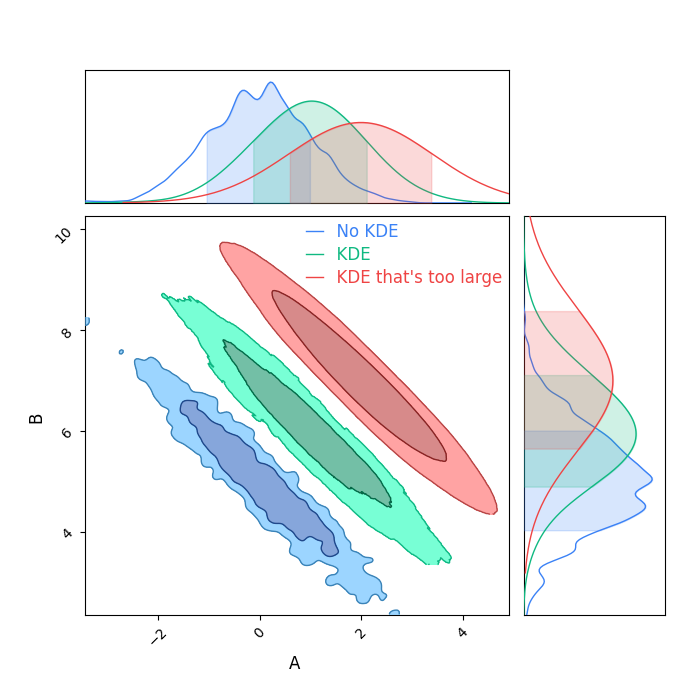
KDE
I don't recommend using KDEs in general, as its very easy to have them inflate your contours if the bandpass isn't tuned well, and its hard to see when it's too large.
Always run more samples if you can, instead of covering up a lack of data with some extra smoothing.
But, if there's no other way, here's how you can do it.
Notice how the KDE, unless its perfectly matched to your distribution, increases the width of the marginal distributions.
from chainconsumer import Chain, ChainConsumer, PlotConfig, make_sample

df = make_sample(num_dimensions=2, seed=3, num_points=1000)
c = ChainConsumer()
c.add_chain(Chain(samples=df, name="No KDE"))
c.add_chain(Chain(samples=df + 1, name="KDE", kde=1.0))
c.add_chain(Chain(samples=df + 2, name="KDE that's too large", kde=2.0))
c.set_plot_config(PlotConfig(flip=True))
fig = c.plotter.plot()
Total running time of the script: ( 0 minutes 10.077 seconds)
Download Python source code: plot_2_kde.py