Note
Click here to download the full example code
Introduction to Summaries
When you have a few chains and want to contrast them all with each other, you probably want a summary plot.
To show you how they work, let's make some sample data that all has the same average.
from chainconsumer import Chain, ChainConfig, ChainConsumer, PlotConfig, Truth, make_sample

# Here's what you might start with
df_1 = make_sample(num_dimensions=4, seed=1)
df_2 = make_sample(num_dimensions=5, seed=2)
print(df_1.head())
Out:
          A         B          C          D  log_posterior
0 -0.104381  5.472475  10.724970  14.645735      -2.878536
1  3.117134  3.168456   8.209680  16.241828      -7.370426
2  0.071446  5.005915   8.711163  16.030487      -3.878100
3 -0.851458  4.399067  11.055568  14.179176      -4.376337
4  0.916041  3.583756   9.632786  14.430202      -5.144193
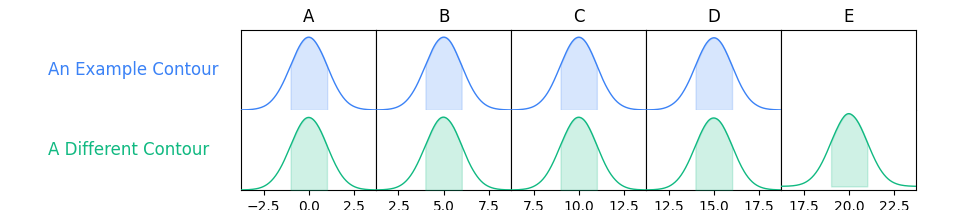
Using distributions
# And now we give this to chainconsumer
c = ChainConsumer()
c.add_chain(Chain(samples=df_1, name="An Example Contour"))
c.add_chain(Chain(samples=df_2, name="A Different Contour"))
fig = c.plotter.plot_summary()
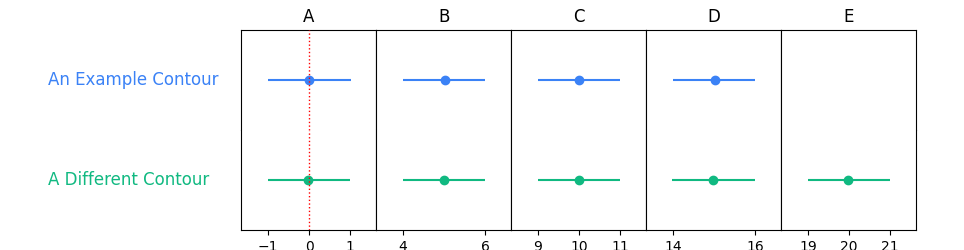
Using Errorbars
Note that because the errorbar kwarg is specific to this function
it is not part of the PlotConfig class.

The other features of ChainConsumer should work with summaries too.
For example, truth values should work just fine.
c.add_truth(Truth(location={"A": 0, "B": 1}, line_style=":", color="red"))
fig = c.plotter.plot_summary(errorbar=True, vertical_spacing_ratio=2.0)
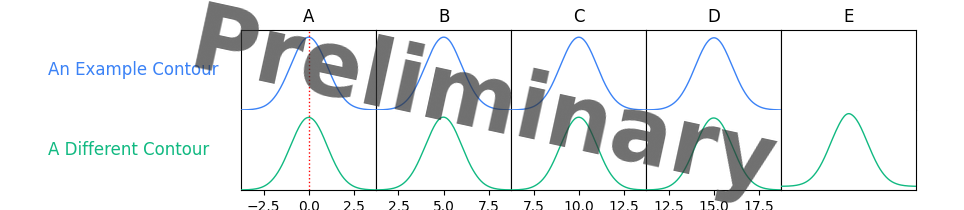
And similarly, our overrides are generic and so effect this method too.
c.set_override(ChainConfig(bar_shade=False))
c.set_plot_config(PlotConfig(watermark="Preliminary", blind=["E"]))
fig = c.plotter.plot_summary()
Total running time of the script: ( 0 minutes 3.847 seconds)
Download Python source code: plot_1_summary.py