Note
Click here to download the full example code
Introduction to Contours
At the most basic, we take a contour as a pandas DataFrame and let ChainConsumer handle the defaults and display.
from chainconsumer import Chain, ChainConfig, ChainConsumer, PlotConfig, Truth, make_sample

# Here's what you might start with
df = make_sample(num_dimensions=2, seed=1)
print(df.head())
Out:
          A         B  log_posterior
0  1.436539  6.962548      -3.325828
1 -1.332336  3.433852      -2.641641
2 -1.006254  4.950566      -2.533945
3 -0.430904  3.890667      -2.223646
4 -0.250947  4.370324      -1.657891
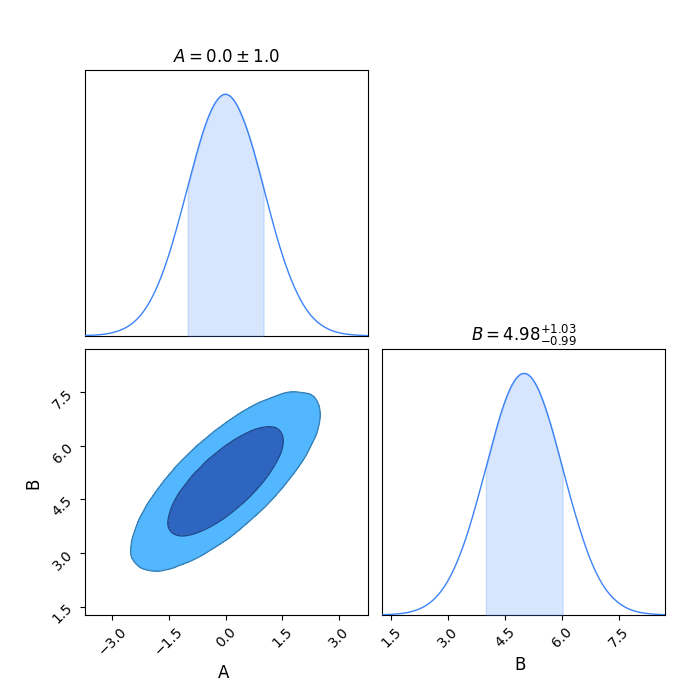
# And now we give this to chainconsumer
c = ChainConsumer()
c.add_chain(Chain(samples=df, name="An Example Contour"))
fig = c.plotter.plot()
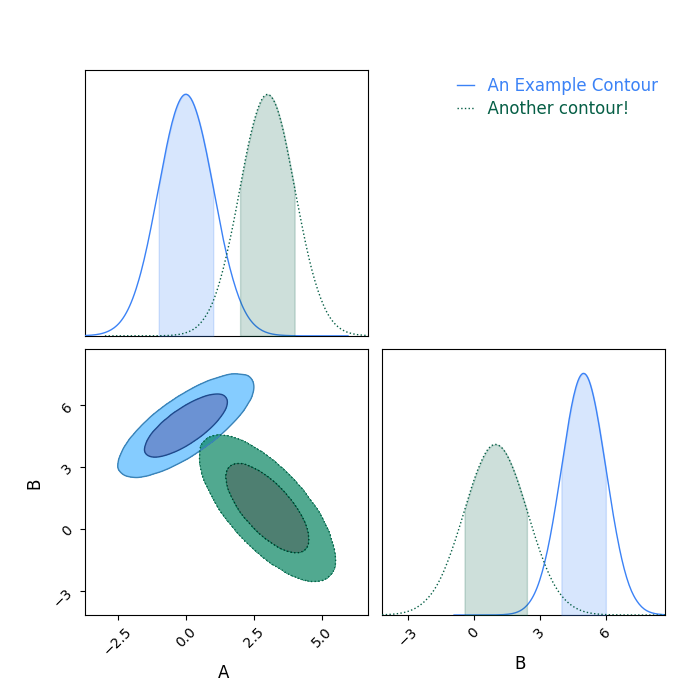
If we wanted to customise the chain, that's easy enough to do.
# Here's a convenience function for you
chain2 = Chain.from_covariance(
    [3.0, 1.0],
    [[1.0, -1], [-1, 2]],
    columns=["A", "B"],
    name="Another contour!",
    color="#065f46",
    linestyle=":",
)
c.add_chain(chain2)
fig = c.plotter.plot()
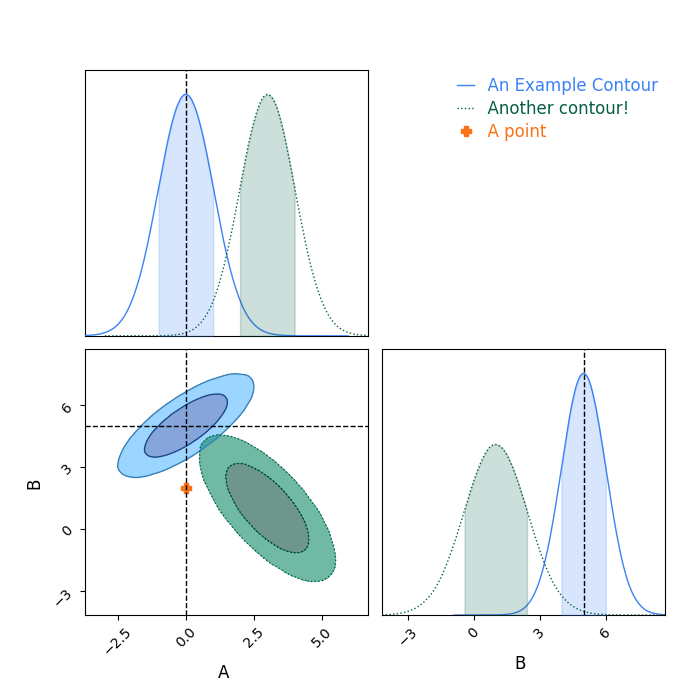
Customising Chains
There's a lot you can configure using chains, and to make it easy, Chains are defined as pydantic base models so you can easily see the default and values you can pass in. Don't worry, there will be plenty of very specific examples in a sub gallery you can check out, but as a final one for here, let's add markers and truth values.
c.add_marker(location={"A": 0, "B": 2}, name="A point", color="orange", marker_style="P", marker_size=50)
c.add_truth(Truth(location={"A": 0, "B": 5}))
fig = c.plotter.plot()
Weights and Posteriors
If you provide the log posteriors in the chain, you can ask for the maximum probability point to be plotted as well. Similarly, if you have samples with non-uniform weights, you can specify the weights column as well.
To keep this clean, let's remake everything. I'm going to add an extra few columns into our dataframe. You'll see what they do
df2 = df.assign(C=lambda x: x["A"] + x["B"])

c = ChainConsumer()
# Customise the chain when you add it
chain = Chain(
    samples=df2,
    name="Example",
    color="k",
    plot_point=True,
    plot_cloud=True,
    marker_style="*",
    marker_size=100,
    num_cloud=30000,
    shade=False,
    linewidth=2.0,
    cmap="magma",
    show_contour_labels=True,
    color_param="C",
)
c.add_chain(chain)
# You can also override *all* chains at once like so
# Notice that Chain is a child of ChainConfig
# So you could override base properties like line weights... but not samples
c.set_override(ChainConfig(sigmas=[0, 1, 2, 3]))
c.add_truth(Truth(location={"A": 0, "B": 5}, color="#500724"))

# And if we want to change the plot itself in some way, we can do that via
c.set_plot_config(
    PlotConfig(
        flip=True,
        labels={"A": "$A$", "B": "$B$", "C": r"$\alpha^2$"},
        contour_label_font_size=12,
    )
)
fig = c.plotter.plot()
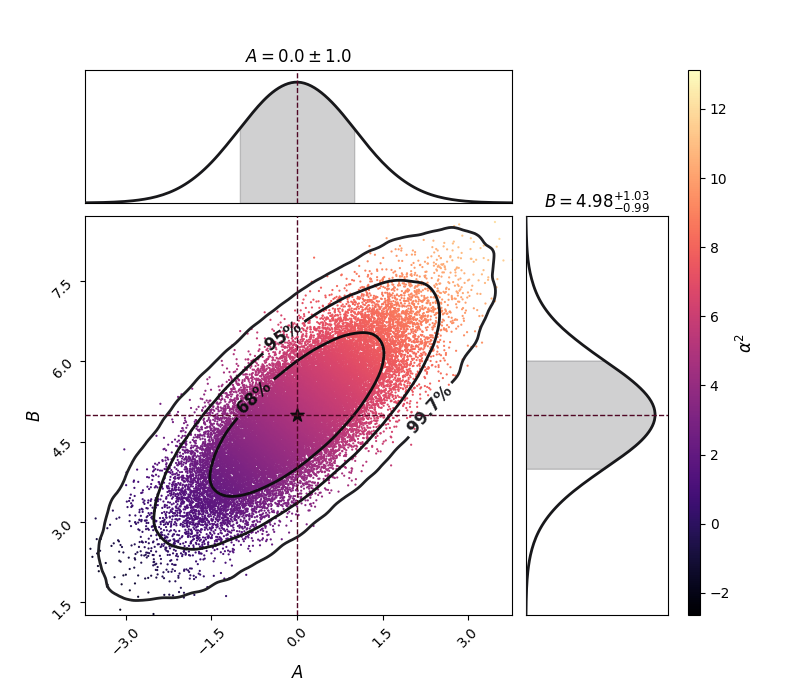
Here the maximum posterior value is used to plot the star-shaped point. A truth line is added in dark red, and instead of plotting $x_3$ as another contour, we use it to provide coloured scatter plots. This is useful if the parameter isn't constrained and has some dependency.
I have used this in the past to show how adding different priors to Hubble's constant (as the color parameter) would pull our fits in different directions.
Now, I am expecting a few comments like: "But Sam, it was easier to do everything in one line before, instead of all these objects."
Having everything as kwargs being passed through made the code a nightmare, type hints impossible, and extensibility poor. By trying to separate things out into appropriate dataclasses, I am hoping it is a lot easier for people to contribute to this code base in the future.
Total running time of the script: ( 0 minutes 5.632 seconds)
Download Python source code: plot_0_contours.py