Note
Click here to download the full example code
Plotting Grid Data
If you don't have Monte Carlo chains, and have grid evaluations instead, that's fine too!
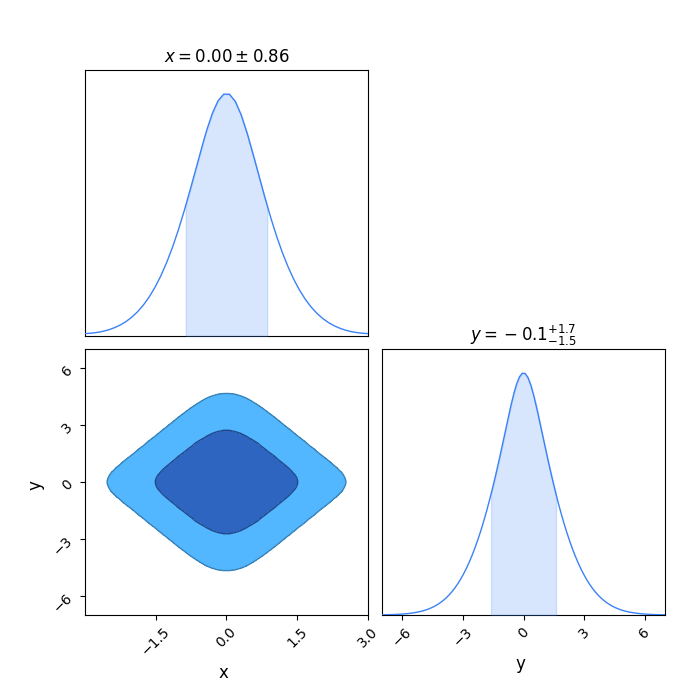
Just flatten your grid, set the weights to the grid evaluation, and set the grid flag. Here is a nice diamond that you get from modifying a simple multivariate normal distribution.
Note that by default, grid data is not smoothed, though you can explicitly set the smooth parameter when you make the Chain object if you want.
Note that you cannot use dictionary input with the grid method and not specify the full flattened array. This is because we cannot construct the meshgrid from a dictionary, as the order of the parameters is not preserved in the dictionary.
import numpy as np
import pandas as pd

from chainconsumer import Chain, ChainConsumer

x, y = np.linspace(-3, 3, 50), np.linspace(-7, 7, 100)
xx, yy = np.meshgrid(x, y, indexing="ij")
likelihood = np.exp(-0.5 * (xx * xx + yy * yy / 4 + np.abs(xx * yy)))
df = pd.DataFrame({"x": xx.flatten(), "y": yy.flatten(), "weight": likelihood.flatten()})

c = ChainConsumer()
c.add_chain(Chain(samples=df, grid=True, name="Grid Data"))
fig = c.plotter.plot()
Total running time of the script: ( 0 minutes 0.233 seconds)
Download Python source code: plot_0_grid.py