Note
Click here to download the full example code
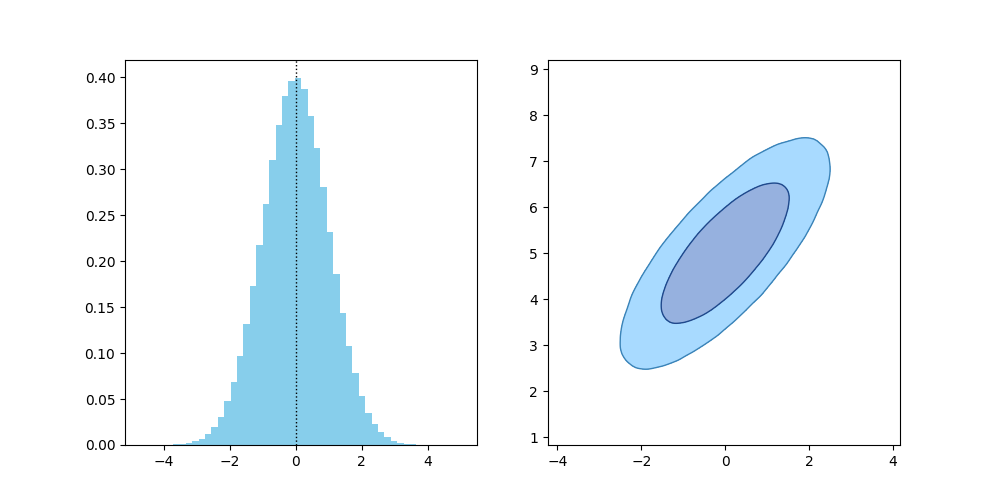
Custom Axes
A lot of the time you might have your own plots ready to go.
In this case, you can manually invoke ChainConsumer's plotting functions.
Here's an example, noting that there are also plot_point, plot_surface available
that I haven't explicitly shown.
import matplotlib.pyplot as plt

from chainconsumer import Chain, Truth, make_sample
from chainconsumer.plotting import plot_contour, plot_truths
df = make_sample(num_dimensions=2, seed=1)

# Custom plotting code
fig, axes = plt.subplots(ncols=2, figsize=(10, 5))
axes[0].hist(df["A"], bins=50, color="skyblue", density=True)

# We can use ChainConsumer to plot a truth value on top of this histogram
truth = Truth(location={"A": 0, "B": 5}, line_style=":")
plot_truths(axes[0], [truth], px="A")
# And also add a contour to the other axis
plot_contour(axes[1], Chain(samples=df, name="Example"), px="A", py="B")
Total running time of the script: ( 0 minutes 0.469 seconds)
Download Python source code: plot_6_custom_axes.py