Note
Click here to download the full example code
Blinding Plots
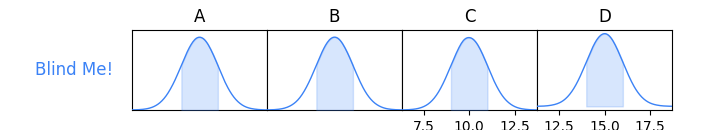
You can blind parameters and not show axis labels very easily!
Just give ChainConsumer the blind parameter when plotting. You can specify True to blind all parameters,
or give it a string (or list of strings) detailing the specific parameters you want blinded!
from chainconsumer import Chain, ChainConsumer, PlotConfig, make_sample

df = make_sample(num_dimensions=4, seed=1)
c = ChainConsumer()
c.add_chain(Chain(samples=df, name="Blind Me!"))
c.set_plot_config(PlotConfig(blind=["A", "B"]))
fig = c.plotter.plot()
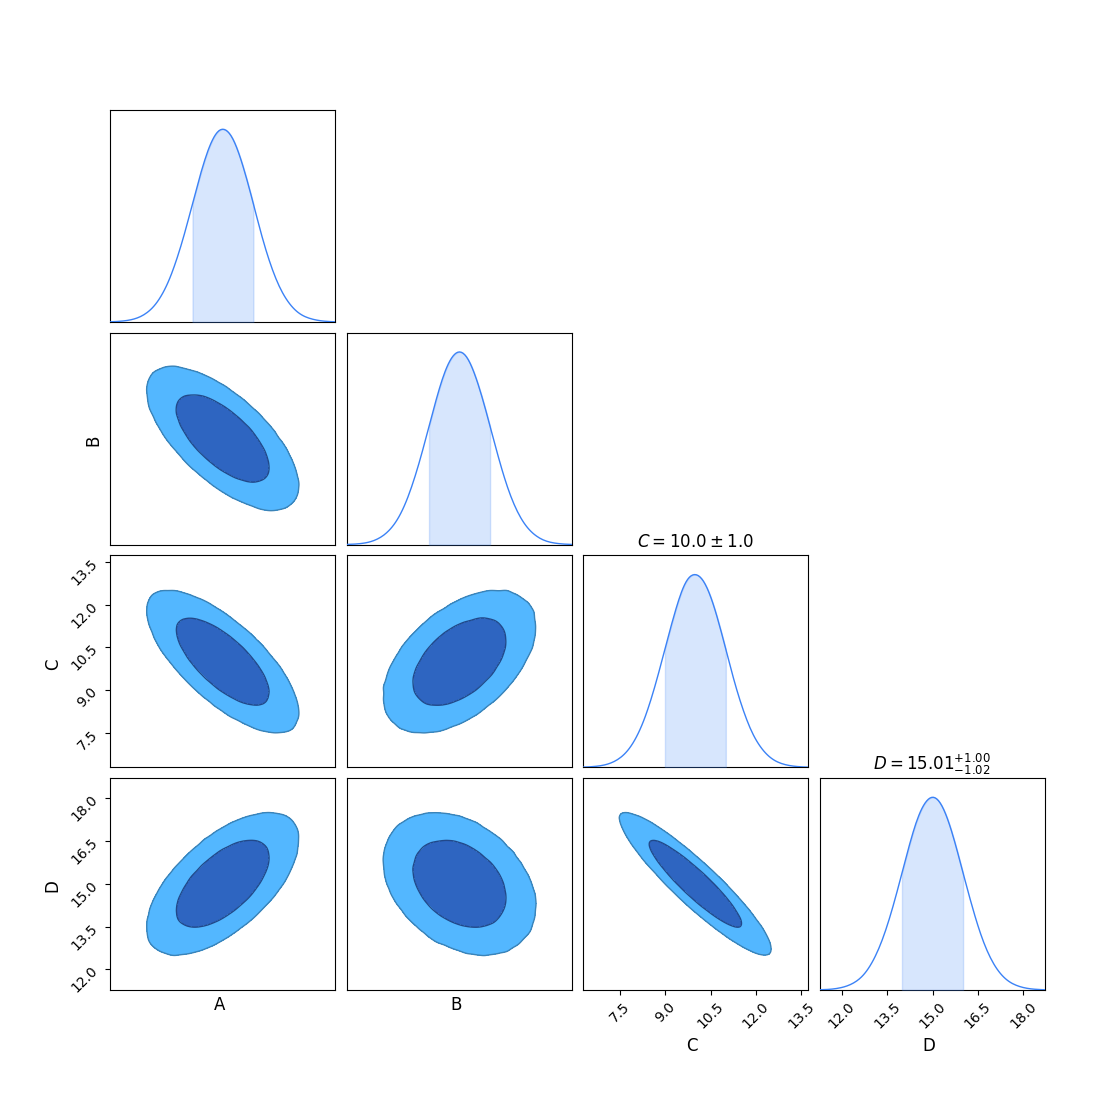
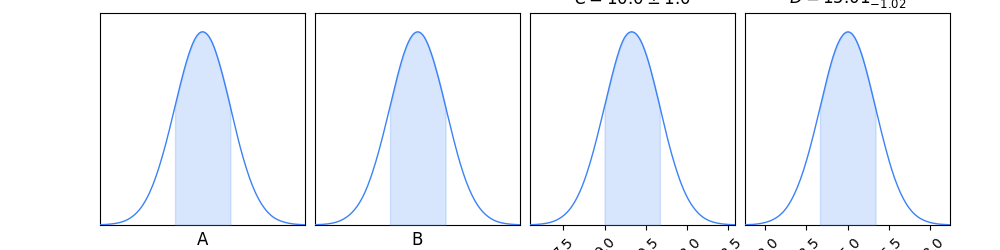
Notice the blinding applies to all plots
And the LaTeX output
Out:
\begin{table}
    \centering
    \caption{}
    \label{tab:model_params}
    \begin{tabular}{ccc}
        \hline
                Model & C & D \\
                \hline
                Blind Me! & $10.03^{+0.98}_{-1.04}$ & $15.0\pm 1.0$ \\
                \hline
    \end{tabular}
\end{table}
Total running time of the script: ( 0 minutes 7.463 seconds)
Download Python source code: plot_1_blinding.py