Note
Click here to download the full example code
Introduction to Walks
Want to see if your chain is behaving nicely? Use a walk!
from chainconsumer import Chain, ChainConsumer, Truth, make_sample

# Here's a sample dataset
df_1 = make_sample(num_dimensions=4, seed=1, randomise_mean=True, num_points=10000)

# And now we give this to chainconsumer
c = ChainConsumer()
c.add_chain(Chain(samples=df_1, name="An Example Contour"))
fig = c.plotter.plot_walks()
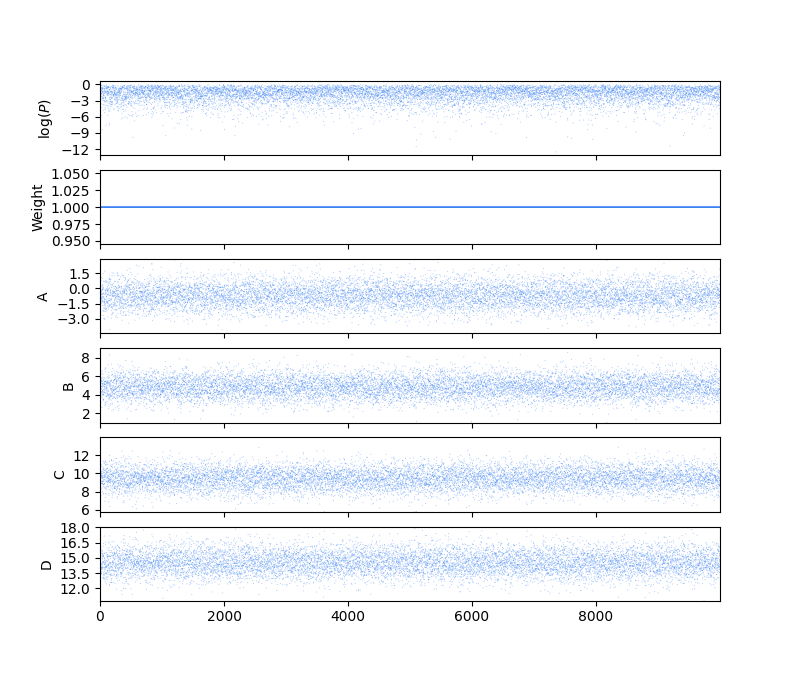
You can add other chains in if you want, though it can get messy to see things.
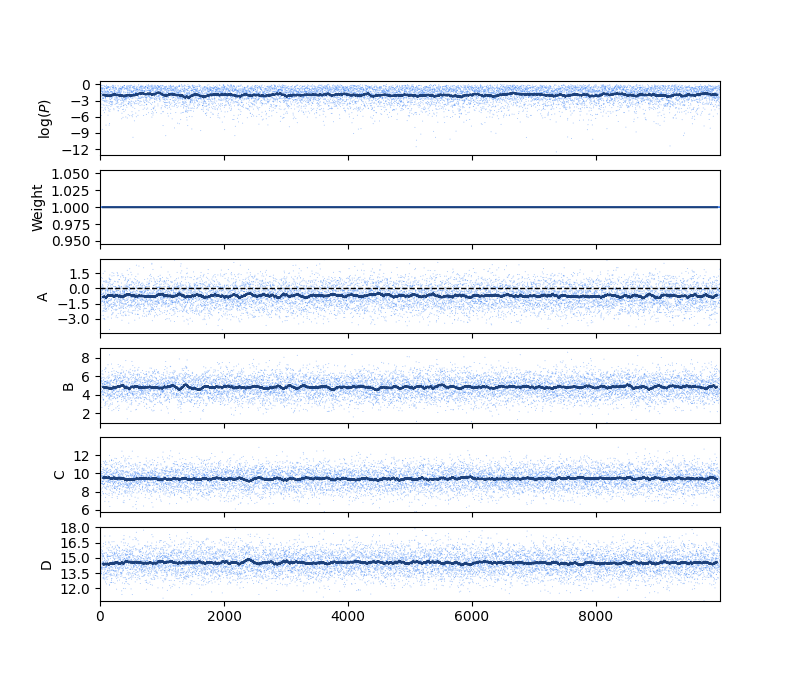
To reduce the mess, try turning on convolve, which will get you a smoothed out version of the walk. And truth lines are always nice.
Total running time of the script: ( 0 minutes 1.627 seconds)
Download Python source code: plot_4_walks.py